Teaching Guide

This teaching guide aims to bring remote sensing to a non-specialized audience and offer support material to teachers, students, and researchers. The goal of this learning resource is so the people who use it can work with satellite images to identify the effects of territorial changes and understand the phenomena that affect climate change.

Become an explorer and see the Earth from space!

The teaching guide consists of two parts:

The EO Browser User Manual

A guide to using the EO Browser application from the Sentinel Hub to explore and download satellite images from the Copernicus program.

Educational ideas

To be used in the classroom. These consist of guided hands-on activities which explain step by step how to make band combinations and download satellite images through case studies

EO Browser User Manual

The EO Browser allows us to process satellite images easily and quickly, and happens to be a lot of fun.聽

Find out how to do it!

Play Video

Natural phenomena and human activities with EO browser

Natural phenomena and human activities that take place on the Earth’s surface can be studied thanks to remote sensing, which is the science that studies the planet鈥檚 surface without making physical contact with it. The sensors used to detect one phenomenon or another, either band combinations or applied indexes, will differ according to whether we want to study forest fires, volcanic eruptions, drought, or urban sprawl.

Below we show how to detect the different phenomena from Sentinel 1 and 2 satellite images available in EO Browser.

Fires

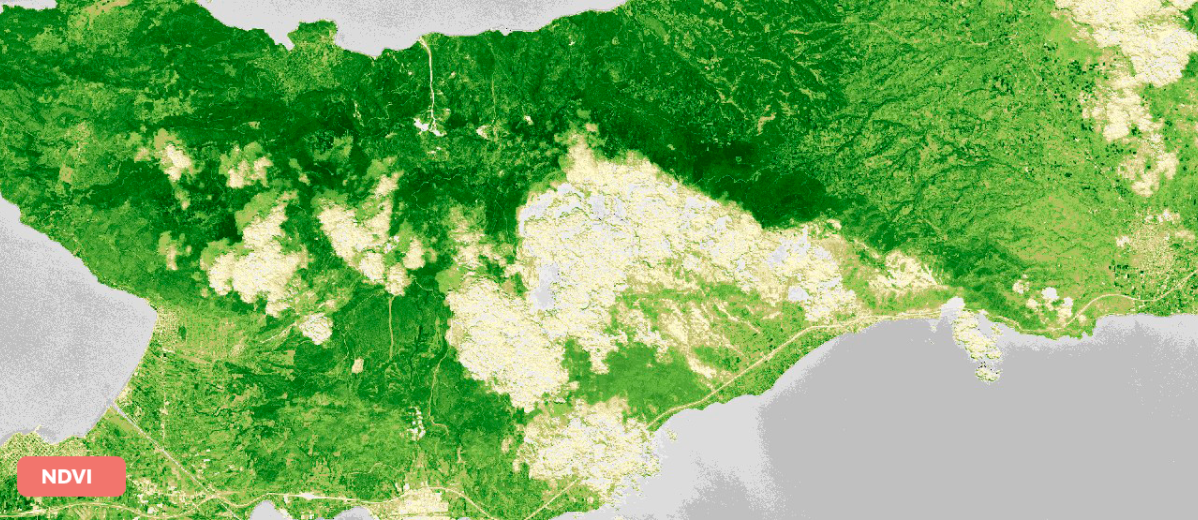
Forest fires are one of the main causes of deforestation in the rainforest and tropical savannah. These tend to take place in the hottest months of the year, normally coinciding when the forest is driest. This is when a small spark can cause an enormous fire, which can easily get out of control when there are uninterrupted swathes of woodland, and even more so if the weather conditions (lack of rainfall, strong winds) help propagate the fire.

Forest fires act similarly all over the world, but their causes and consequences are very different, depending on the region of the planet.

Fires that take place in developed countries are often worsened by the abandonment of crop fields that traditionally acted as fire breaks. The spontaneous growth of vegetation in abandoned farmland has been responsible for the growth of the forest mass which has now formed uninterrupted stretches of forested area across the land.

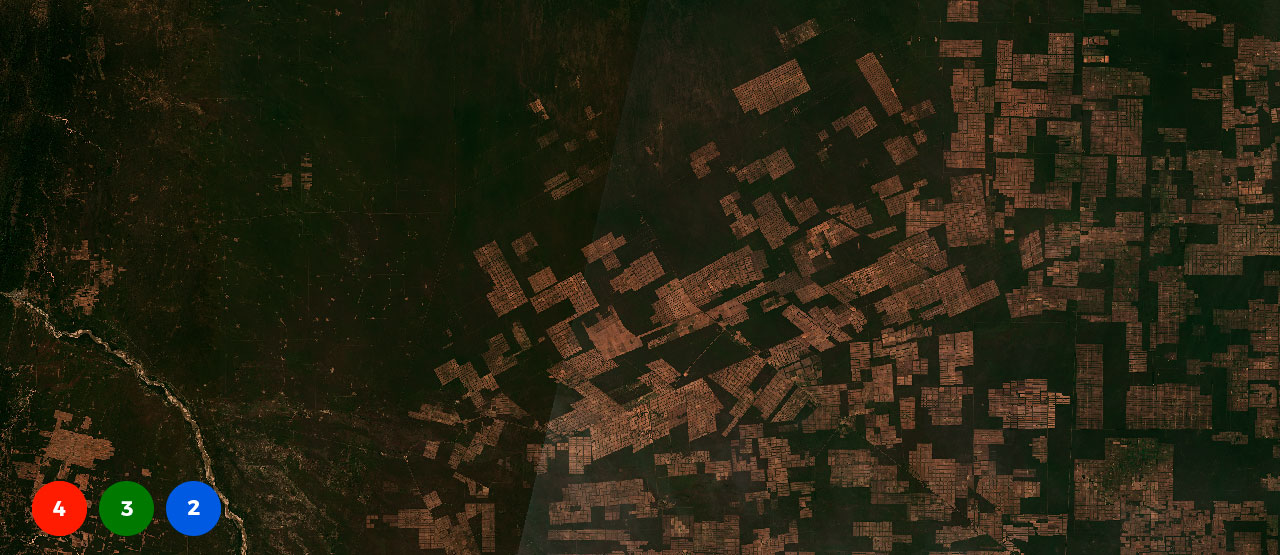
On the other hand, fires in developing countries tend to be intentionally set with the aim of deforesting an area to plant large single-crop plantations or pasturelands.

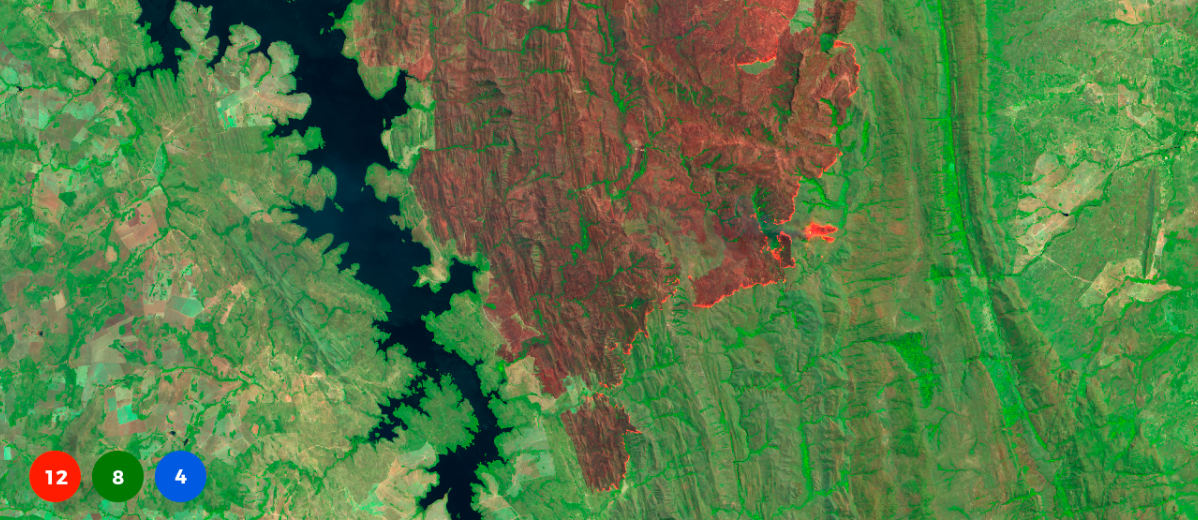
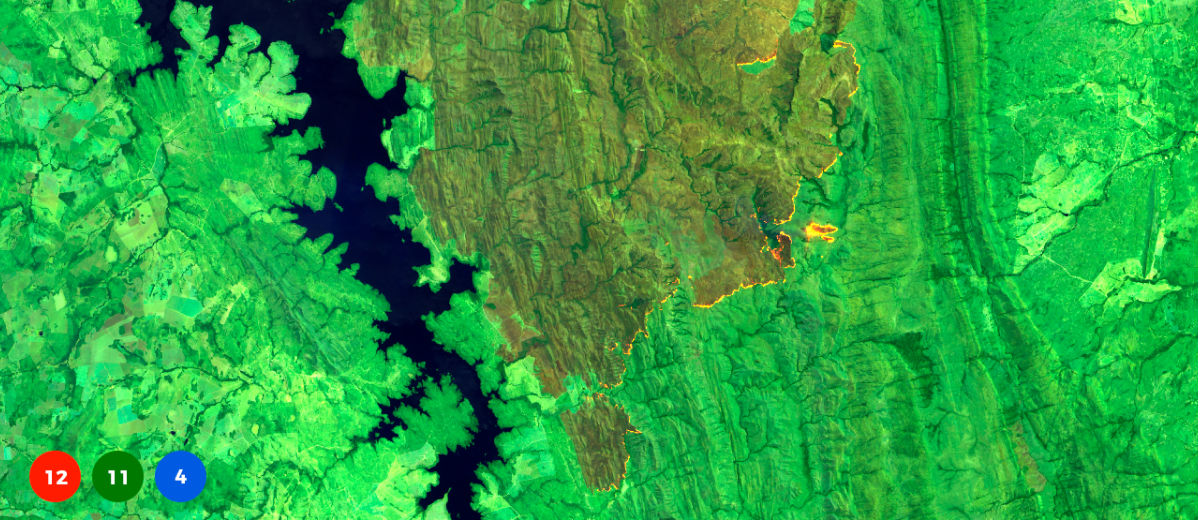
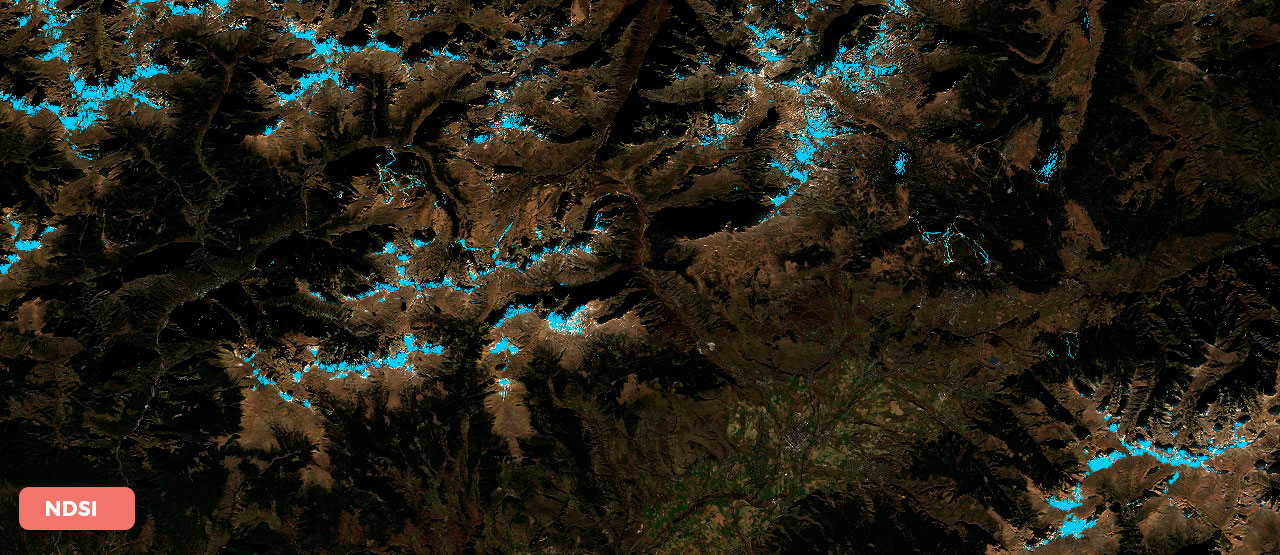
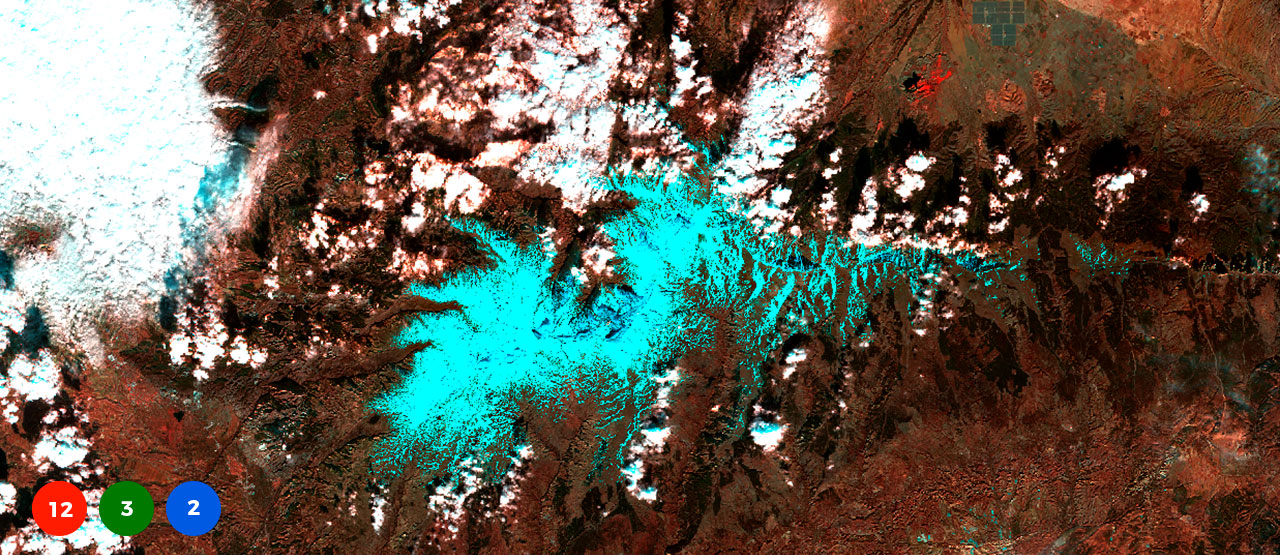
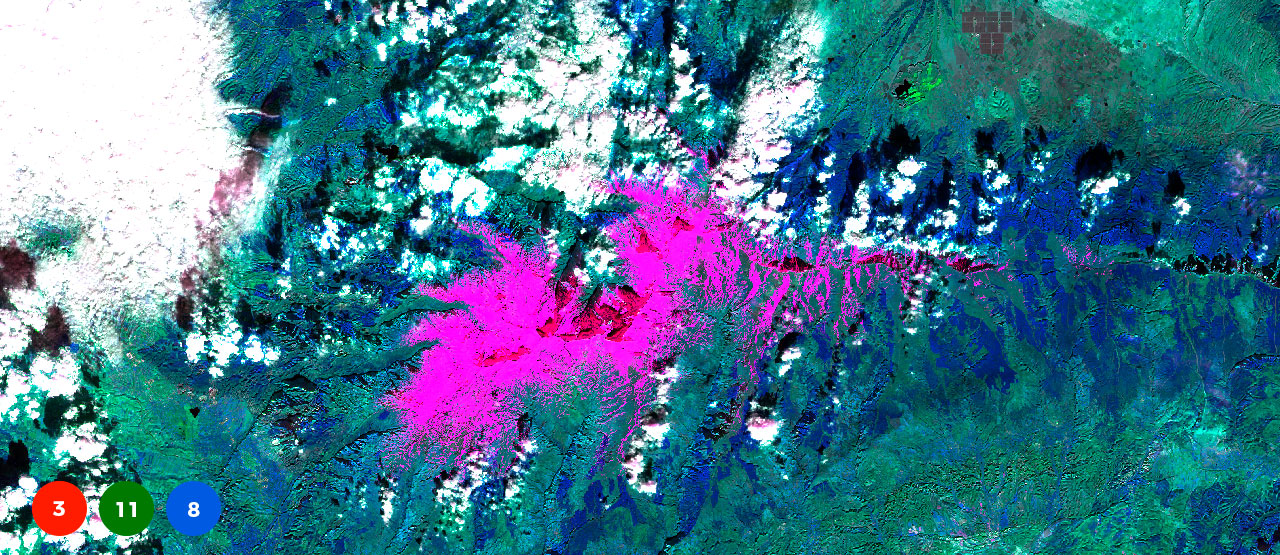
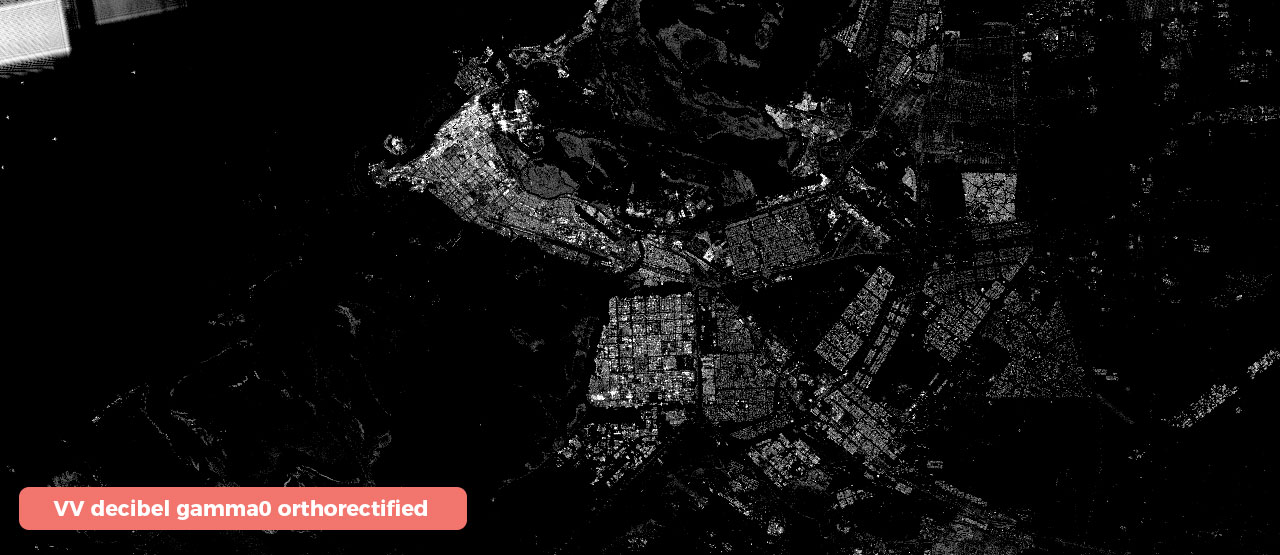
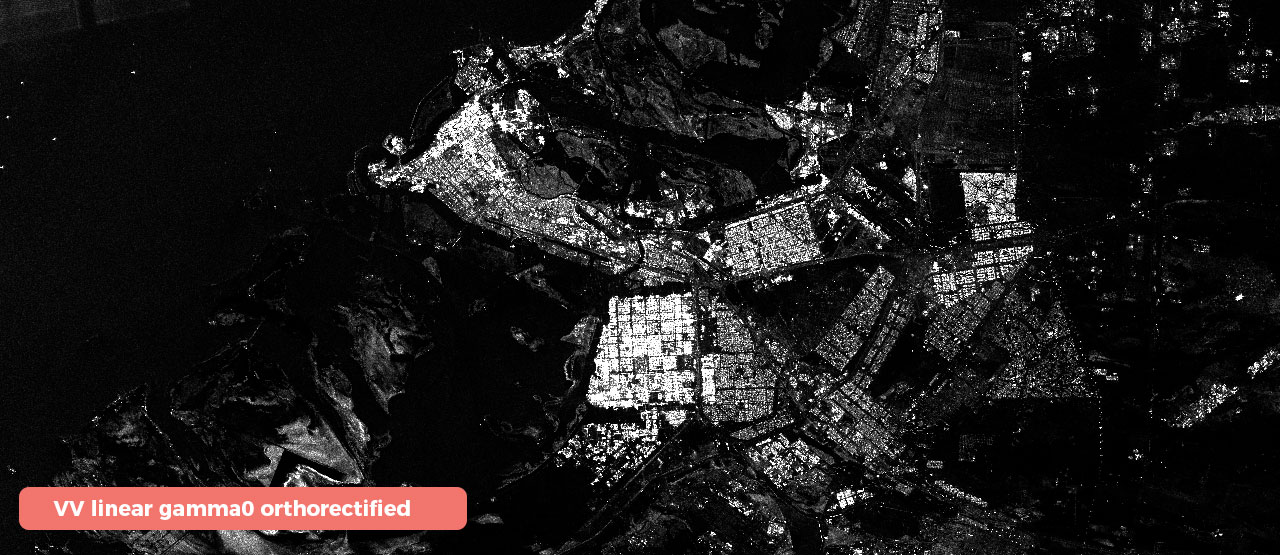
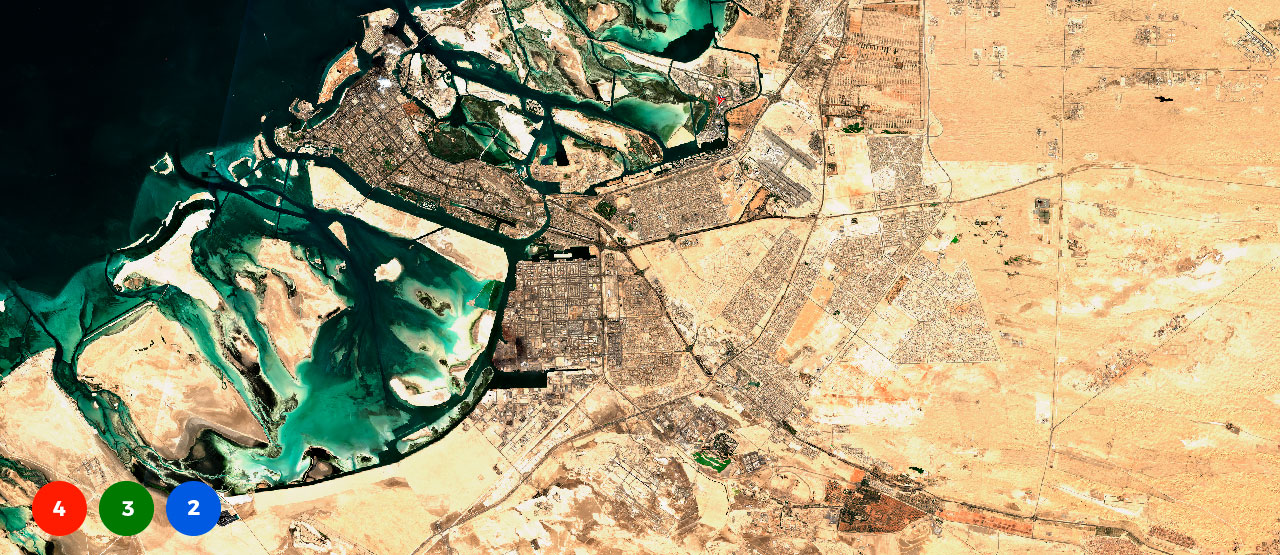
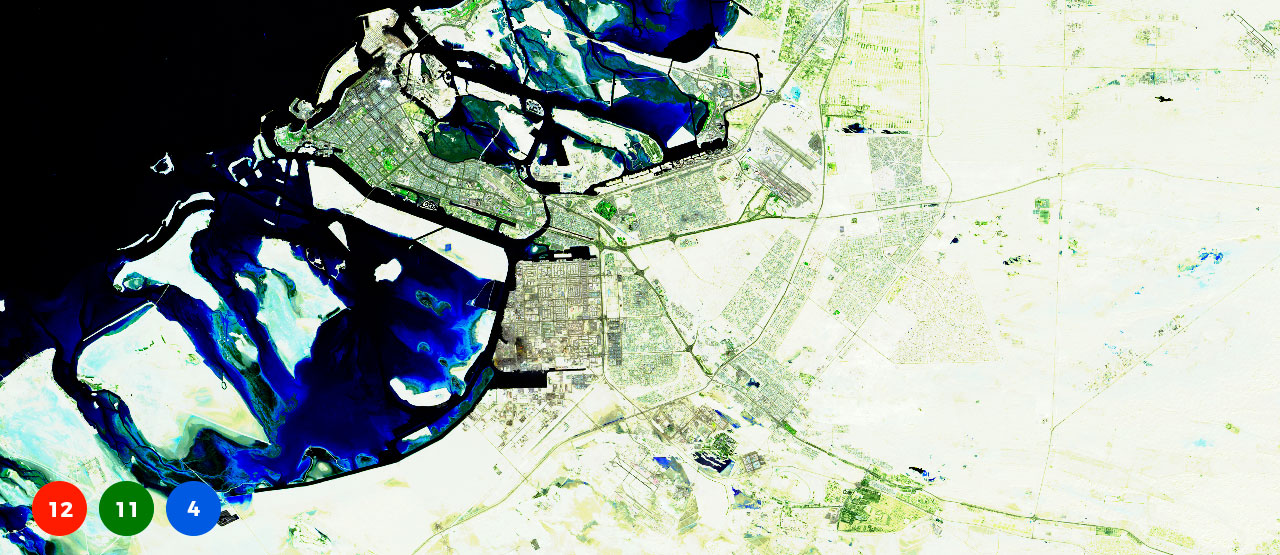
How to detect fires with EO Browser and Sentinel satellite imagery?

Index
index incendi
Band combination
incendi combinaciones de bandes

incendi combinaciones de bandes 2

Volcanic eruptions

A volcanic eruption is a violent release of material through the Earth’s surface coming from the centre of the planet. This natural phenomenon does not occur with any sense of regularity, making them completely unpredictable. Satellite images allow us to observe how an eruption occurs, as well as how it affects the surrounding area. Satellites allow us to quantify the contamination of the air exhumed by the explosion, as well as the advancing lava flows and resulting forest fires.

How to detect volcanic eruptions with EO Browser and Sentinel satellite imagery?

Index
index volcans

Band combination
volcans combinacio de bandes

incendi combinaciones de bandes 2

Floods

Floods are a natural catastrophe that threatens towns and cities located in floodplains and deltas. The increased frequency and intensity of storms, due to climate change, is aggravating the problems whose source can be traced to existing town planning.

The sprawl of populated areas has exponentially increased in recent decades when land ordinances were lax or non-existent. This has meant that a large part of the urban fabric has been built in the floodplain, whether the waters return in 50, 100 or 500 years.

How to detect floods with EO Browser and Sentinel satellite imagery?

Index
index inundacions

Logging

Deforestation by clearing cutting forests, whether it is for lumber, single-crop plantations or livestock raising, is one of the main reasons for the loss of biodiversity. Deforestation reduces and fragments habitats, and also threatens into extinction the species and local communities living in these habitats or environments.

How to detect logging with EO Browser and Sentinel satellite imagery?

Index
index tala de boscos

tala de boscos

Band combination
tala boscos

Drought / exploitation of water resources

A drought is a period in which an area experiences below-average precipitation for its climate. Drought severely affects the availability of food, and thus affects the behaviour of the area鈥檚 inhabitants, who have to emigrate to seek better living conditions.

Water scarcity due to natural causes is not the only phenomenon that threatens the well-being of plants and animals. The rise of the world’s population and more advanced technology in recent decades has caused many rivers, lakes, lagoons and even seas to dry up as a result of poor water management. The indiscriminate exploitation of water resources has been a key factor in landscape alteration, migrations, and war.

How to detect drought and exploitation of water resources with EO Browser and Sentinel satellite imagery?

Index
index sequeres 1

index sequeres 2

Band combination
combinaci贸 de babndes sequeres

Receding glaciers

Shrinking icecaps and glaciers is the result of the melting of ice and snow from the rising temperatures. Every spring, when the days grow warmer, most mountain snow melts and feeds surface rivers and lakes, aquifers, and the sea. Climate change is accelerating this melting as the global temperature increase is causing less snow to accumulate during the wintertime, which would then melt in the warmer months.

In recent years, ice that had spent centuries accumulating at the polar icecaps and mountaintops has melted away. Scientists are convinced that global warming has melted the majority of mountain glaciers and snowpack, and irreversibly reduced the extension of the polar icecaps. But the rhythm that ice melts is hard to observe in satellite images, as the abundance of clouds in snow zones makes it hard to see the land surface. That is why some satellites, such as the Sentinel-1, are fitted with radar sensors, which can accurately capture the melting ice of the poles and mountain glaciers.

How to detect melting with EO Browser and Sentinel satellite imagery?

Index
index desgel

Band combination
combinaci贸 de bandes desgel

combinaci贸 de bandes desgel 2

Urban sprawl

The world’s population has experienced extraordinary growth in the recent decades. In fact, the population has nearly doubled in less than 50 years, rising from approximately 4 billion in 1975 to 7.5 billion today. The population increase implies more and more facilities and infrastructure to satisfy the needs of current society. By this we principally refer to housing, the production of goods and services and the mobility of people and freight.

Undoubtedly this results in land transformation, and more specifically, urban development. After all, from time immemorial man has modified the environment in which he lives with the sole aim of suiting it to his needs and convenience. It is natural, then, with today’s great technical and technological capacity, this environmental transformation has meant urban growth at all levels: urban sprawl, implementation of large infrastructure, and even the appearance of land developments in the middle of the ocean. Satellites provide a spectacular view of the spellbinding pace of construction in all corners of the planet.

How to detect urban sprawl with EO Browser and Sentinel satellite imagery?

Band combination

combinaci贸 de bandes creixement urbanistic

combinaci贸 de bandes creixement urbanistic 2

Educational idea

Look at the Earth through satellite images

Who is it for?
This activity is intended for Earth Science and Social Science students in secondary and high school, although the material can be adapted to different student levels.

Number of participants
20-30 students. The students should form groups of 5.

Type of activity
Cooperative learning

Objectives

01
Introduce students to the field of Remote Sensing and learn how to identify real natural phenomena.

02
Make students aware of the Copernicus program and the free availability of satellite images.

03
Identify the causes and consequences of natural phenomena such as floods, drought, deforestation, etc.

Material

路 Classroom with computers and an Internet connection. Each group must have one or two computers.
路聽EO Browser聽 available from any browser. The user must be previously registered on the platform.
路 Teaching material available on the Edusat website.

Duration

The duration of the activity is a maximum of 5 hours. The time can be adapted according to the availability of the group and divided as follows:
Block 1. Context and assumptions (2h).
Block 2. Research of case studies (2h).
Block 3. Presentation of results (1h).

Description and steps to follow

Block 1. Context and assumptions

Context

The first part consists of a session of a theoretical nature where the teacher explains the principles of remote sensing (satellites, sensors, electromagnetic radiation and band combinations) and how this technology can help detect natural disasters or human activity derived from the climate crisis.

The goal of this section is to contextualize the students in the theme of global environmental change and explain the principles of remote sensing in a simple and enjoyable way.

EO Browser demo

The block also contains a part where the teacher makes a demonstration of how to use the聽EO Browser聽application to look for satellite images and make band combinations.

Case of study

Finally, students must divide into groups of 5 and choose what phenomena or case of study they want to research. It is recommended for each group to work with a different theme and they must identify possible case studies that have occurred recently and had a repercussion in the media. Some examples can be the fires in Australia, deforestation in the Amazon, the cyclone in the Philippines, etc.

For this first block, the teacher has the following resources:
To practice, students can explore the case studies found on the website:

Block 2. Research of the case study

The second part is based on group work. The aim is to explore the information that satellites give us on a specific episode and identify what changes occurred before and after the phenomenon.

It will be necessary for them to search through digital media and compile information on the case study (exact date when the phenomena occurred, the place, photographs of the event and any other information that might be interesting for their research). Afterwards, they must explore the satellite images using the EO Browser application and聽making the corresponding band combinations to produce a result.

Block 3. Presentation of the results

Finally, it is suggested that each group make a presentation of the case studies they have explored and show their results to the other groups. For the presentation, they have to share the satellite images and explain why they have used certain band combinations and not others.

Guidance for the teacher

It is recommended that students explore phenomena near their geographic area or have made an impact in the media, therefore making it easier to find information.

Explore this teaching guide on your own and investigate new case studies. Share your results on social media with the hashtag #edusat.

We are interested in continuing to improve Edusat. If you have any suggestion for improvement, share it with us.

Other useful information

Download the infographics